Reclamation manifest · macOS & Linux · open source
Every gigabyte, inspected and tagged.
dscan walks your disk like an auditor with a clipboard: caches and build output get stamped SAFE and hauled away, anything ambiguous is flagged REVIEW, and your work is marked KEEP — never touched.
Manifest — /Users/you · 38.0 GB sampledInspecting 0%
SAFEDerivedData3.8 GB
SAFEnpm cache3.0 GB
SAFECaches2.3 GB
SAFEpnpm1.2 GB
SAFEcargo0.8 GB
SAFE.cache0.6 GB
REVIEWnode_modules1.9 GB
REVIEWsimulators1.4 GB
REVIEWJetBrains2.9 GB
REVIEWAndroid SDK2.1 GB
KEEPyour projects18.0 GB
SAFE — removedREVIEW — flagged, your callKEEP — never touched
Scroll to run the inspection ▾
All releases (macOS / Linux)
go install github.com/gor3a/disk-scan@latestExhibit A — the Clean up tab
Three tiers. Zero guesswork.
Every candidate is classified before you see it. The numbers below are a real scan — the same one in the screenshot.
SAFECaches & build output — Xcode DerivedData, npm/pnpm stores, Cargo registry. They regenerate on next use.11.7 GB
REVIEWWorth a look — stale node_modules, unused simulators, old toolchains. Flagged, never auto-deleted.8.3 GB
KEEPYour work — projects, documents, anything dscan can't prove is disposable. Off limits by design.untouched
Inspected · v1.4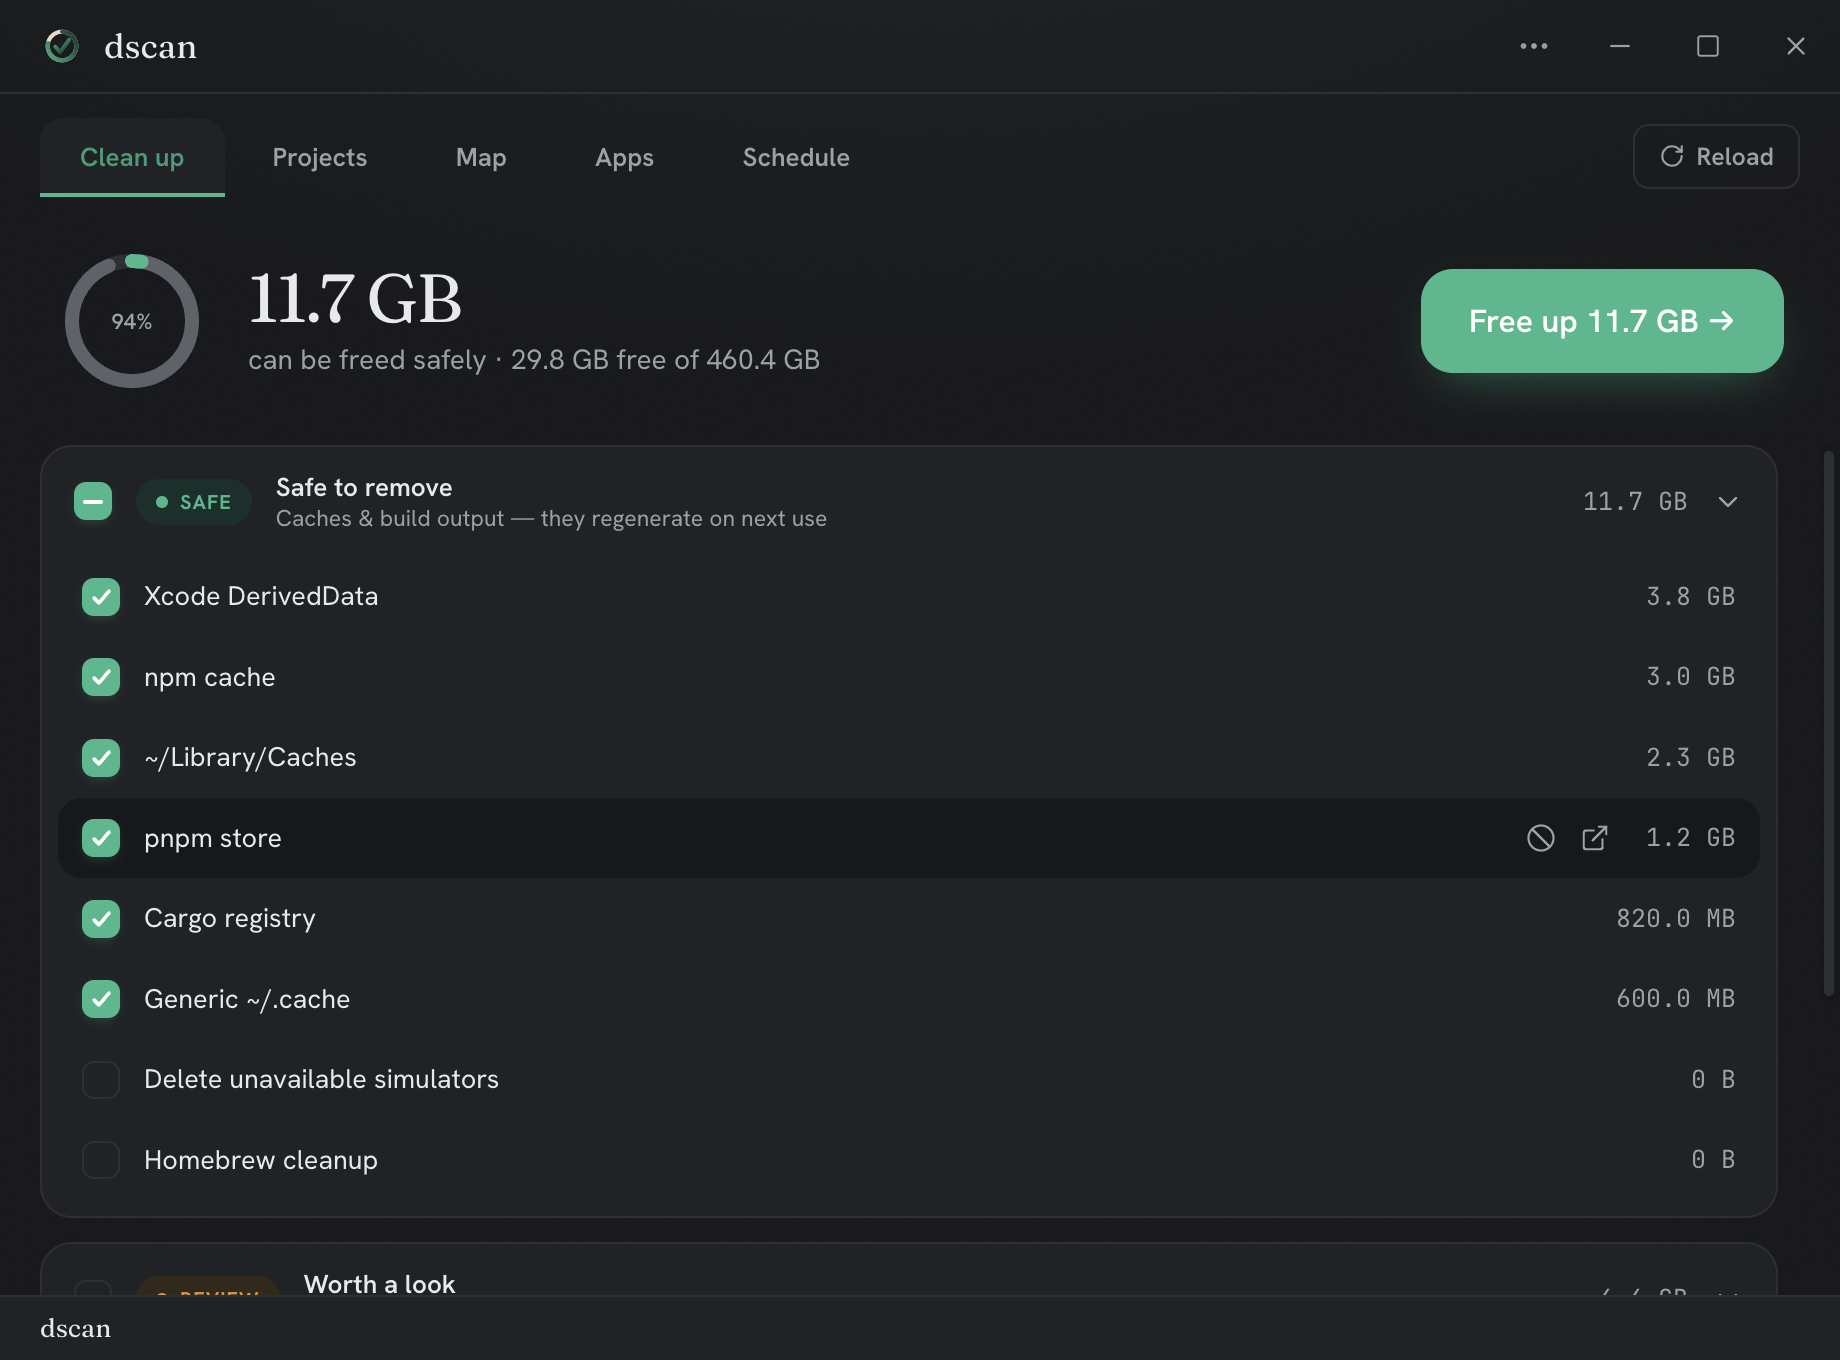
Fig. 01 — Clean up · live scan11.7 GB safe to free
01 — projects
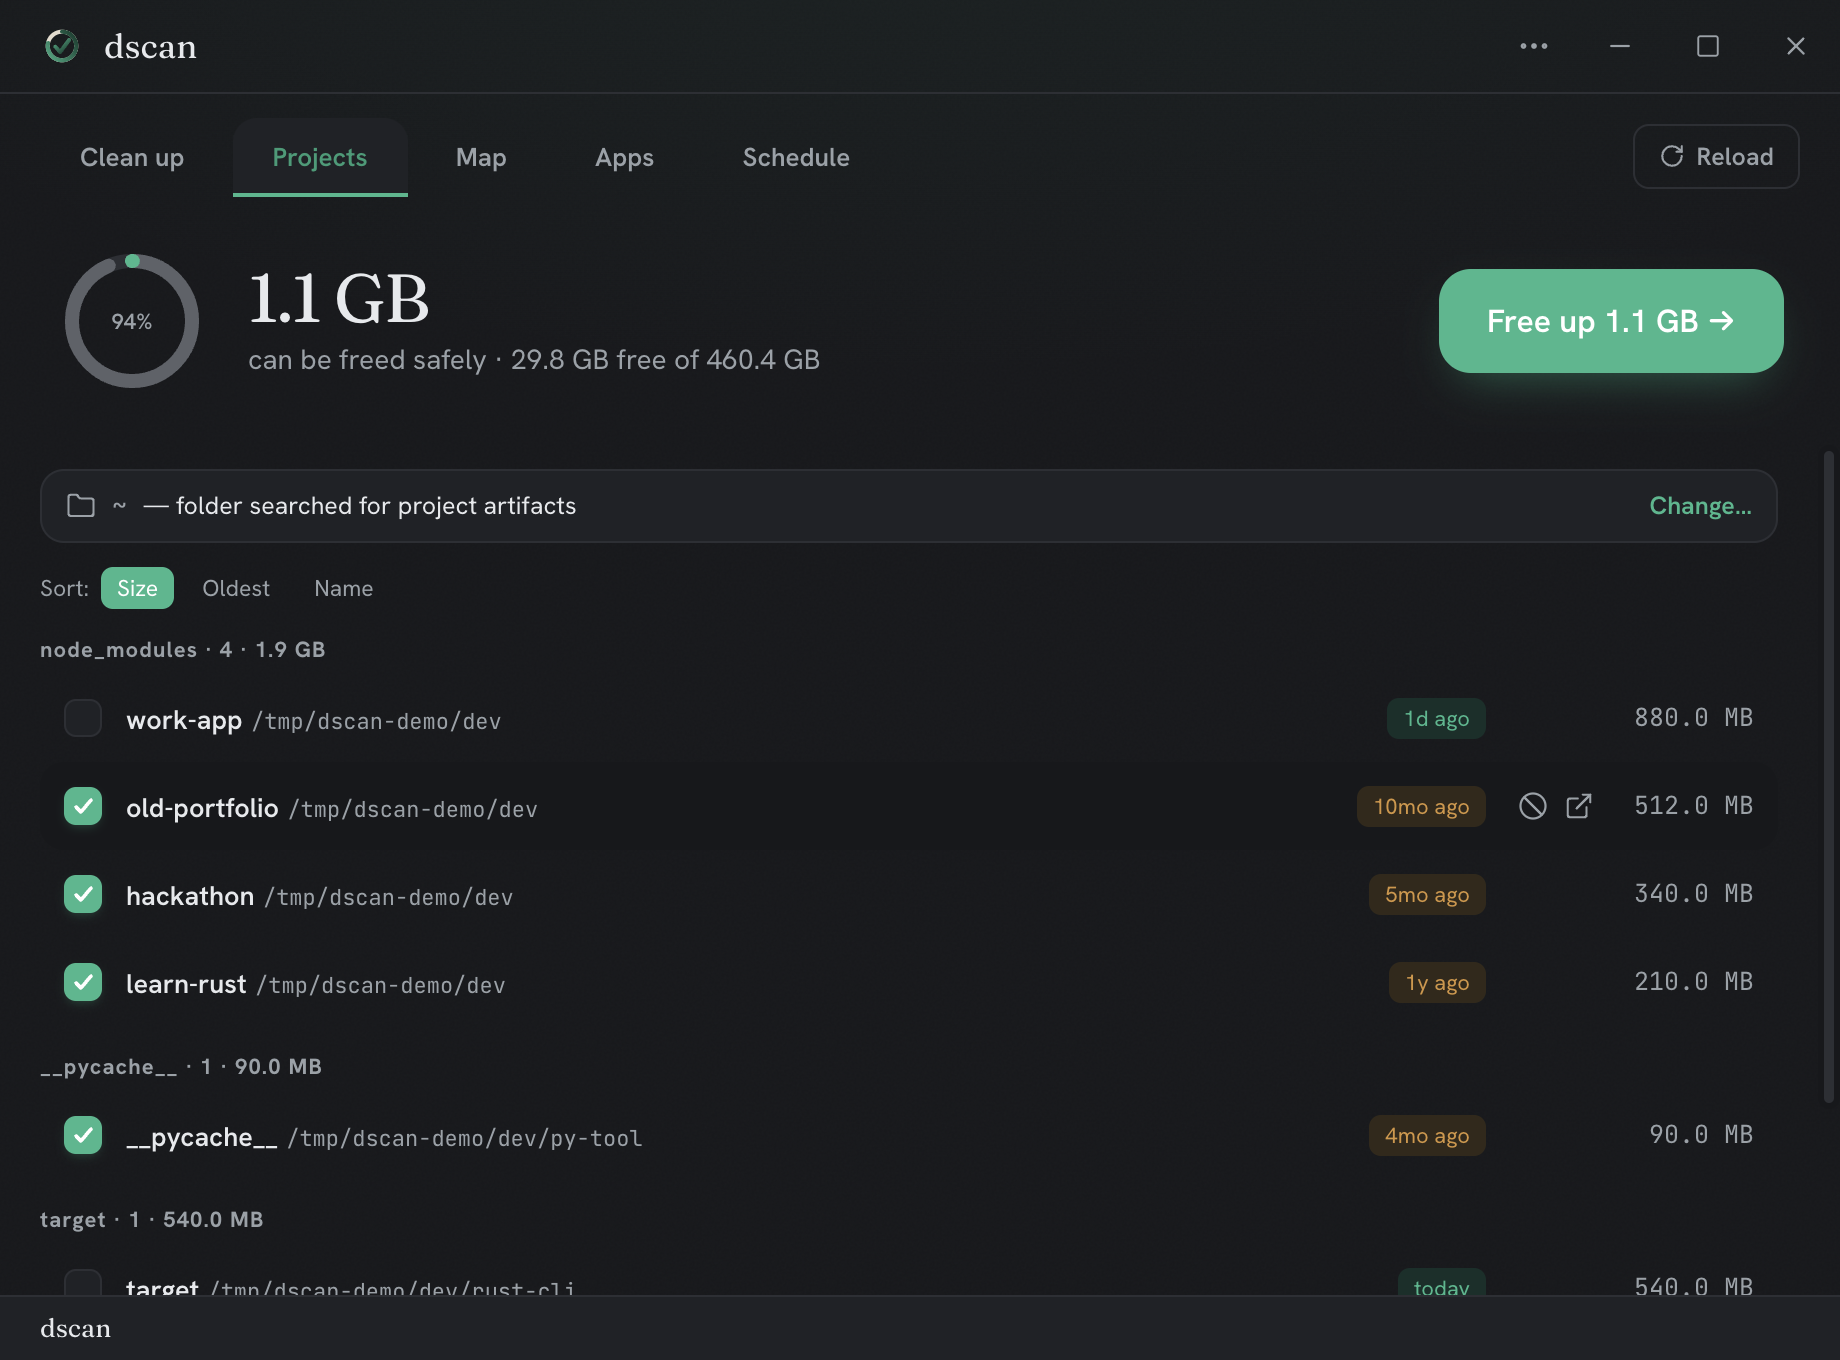
Projects
Find and clear heavy build artifacts — node_modules, .next, target, __pycache__ — across a folder, grouped by kind.
02 — apps
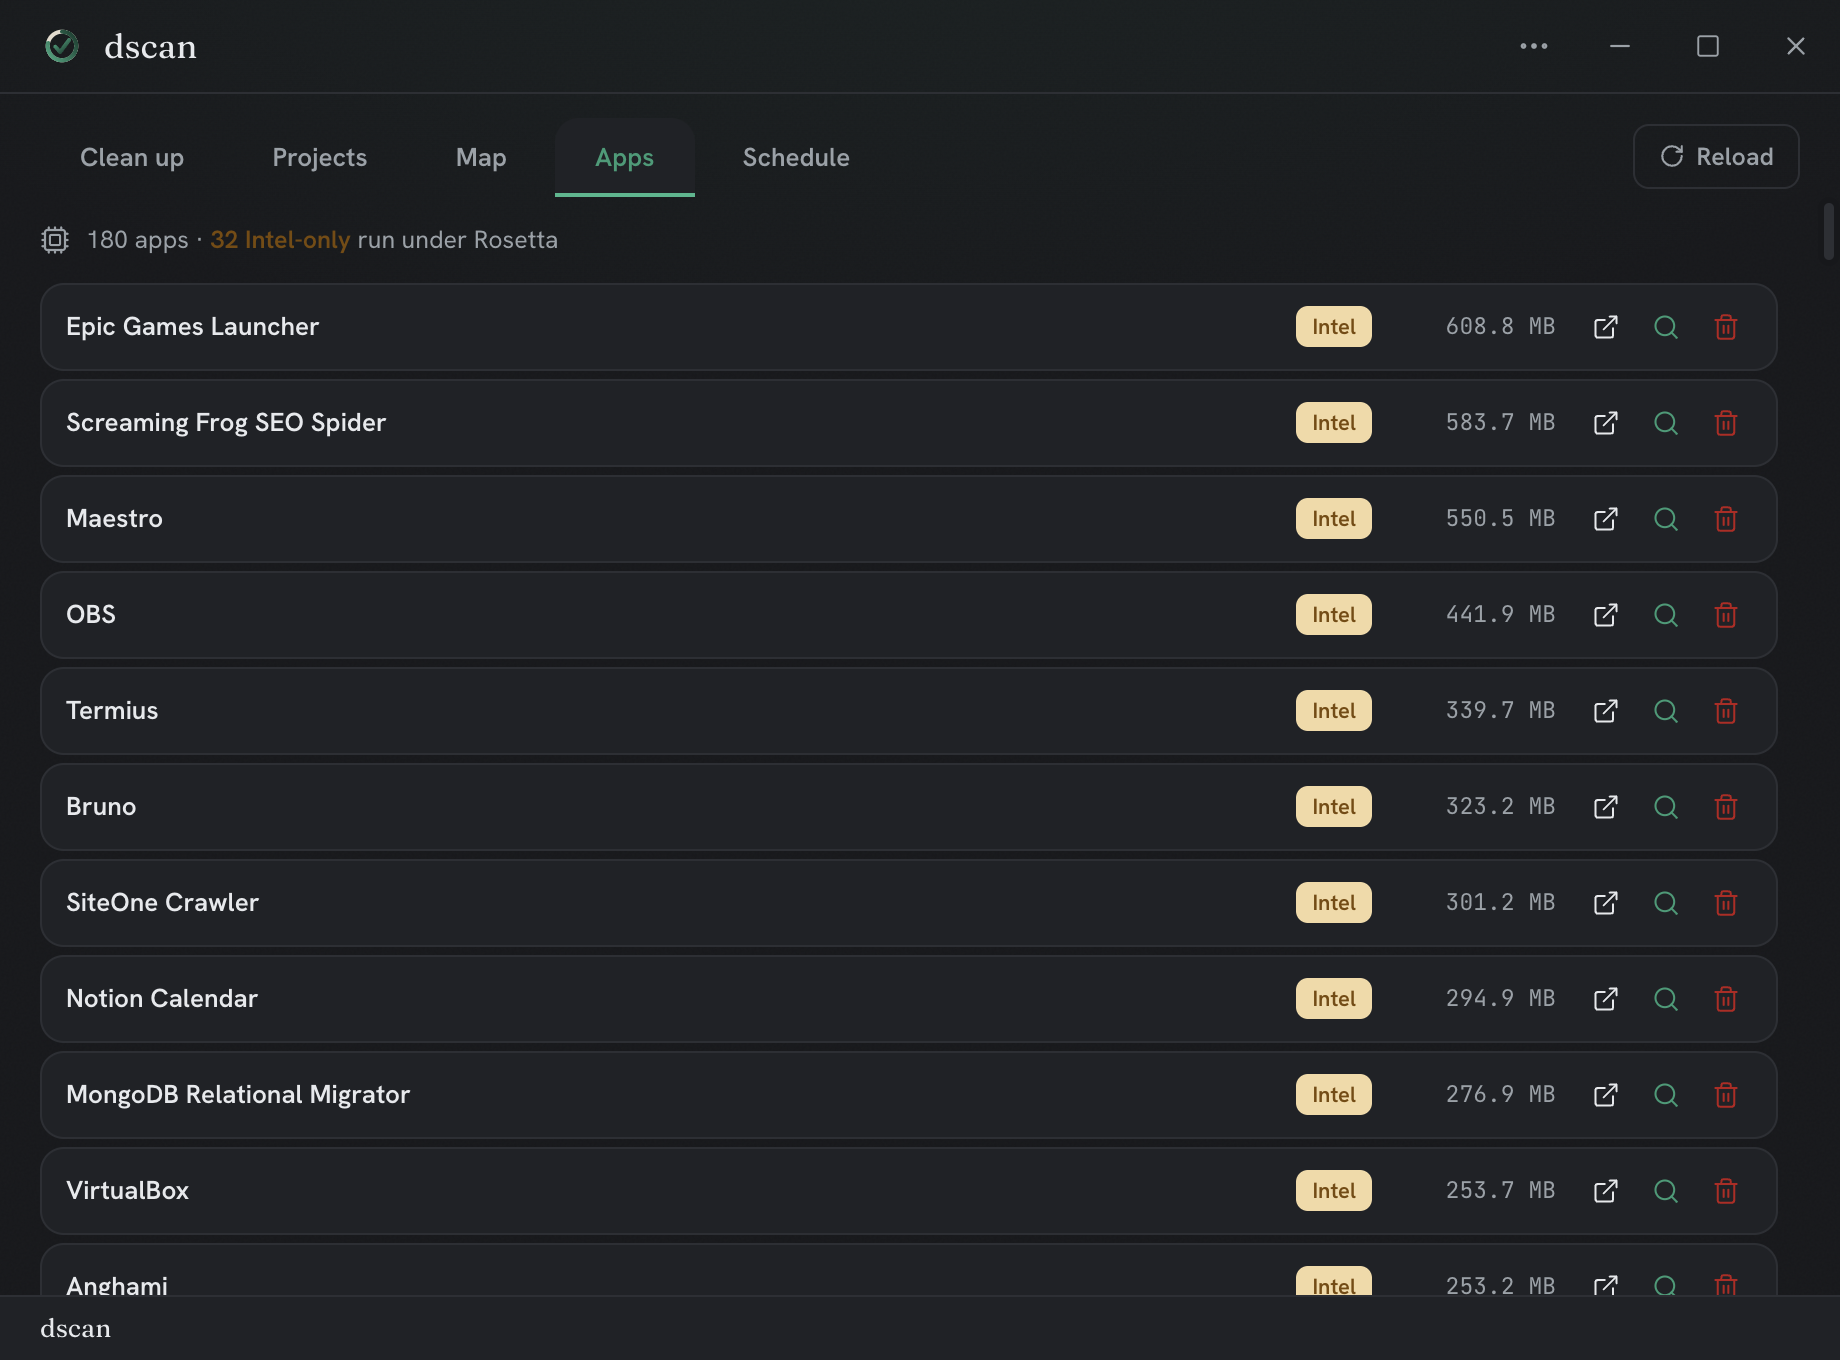
Apps
See which installed apps are unused, oversized, or still running under Rosetta on Apple Silicon — with an honest picture of what is actually taking up space.